Visualization tool
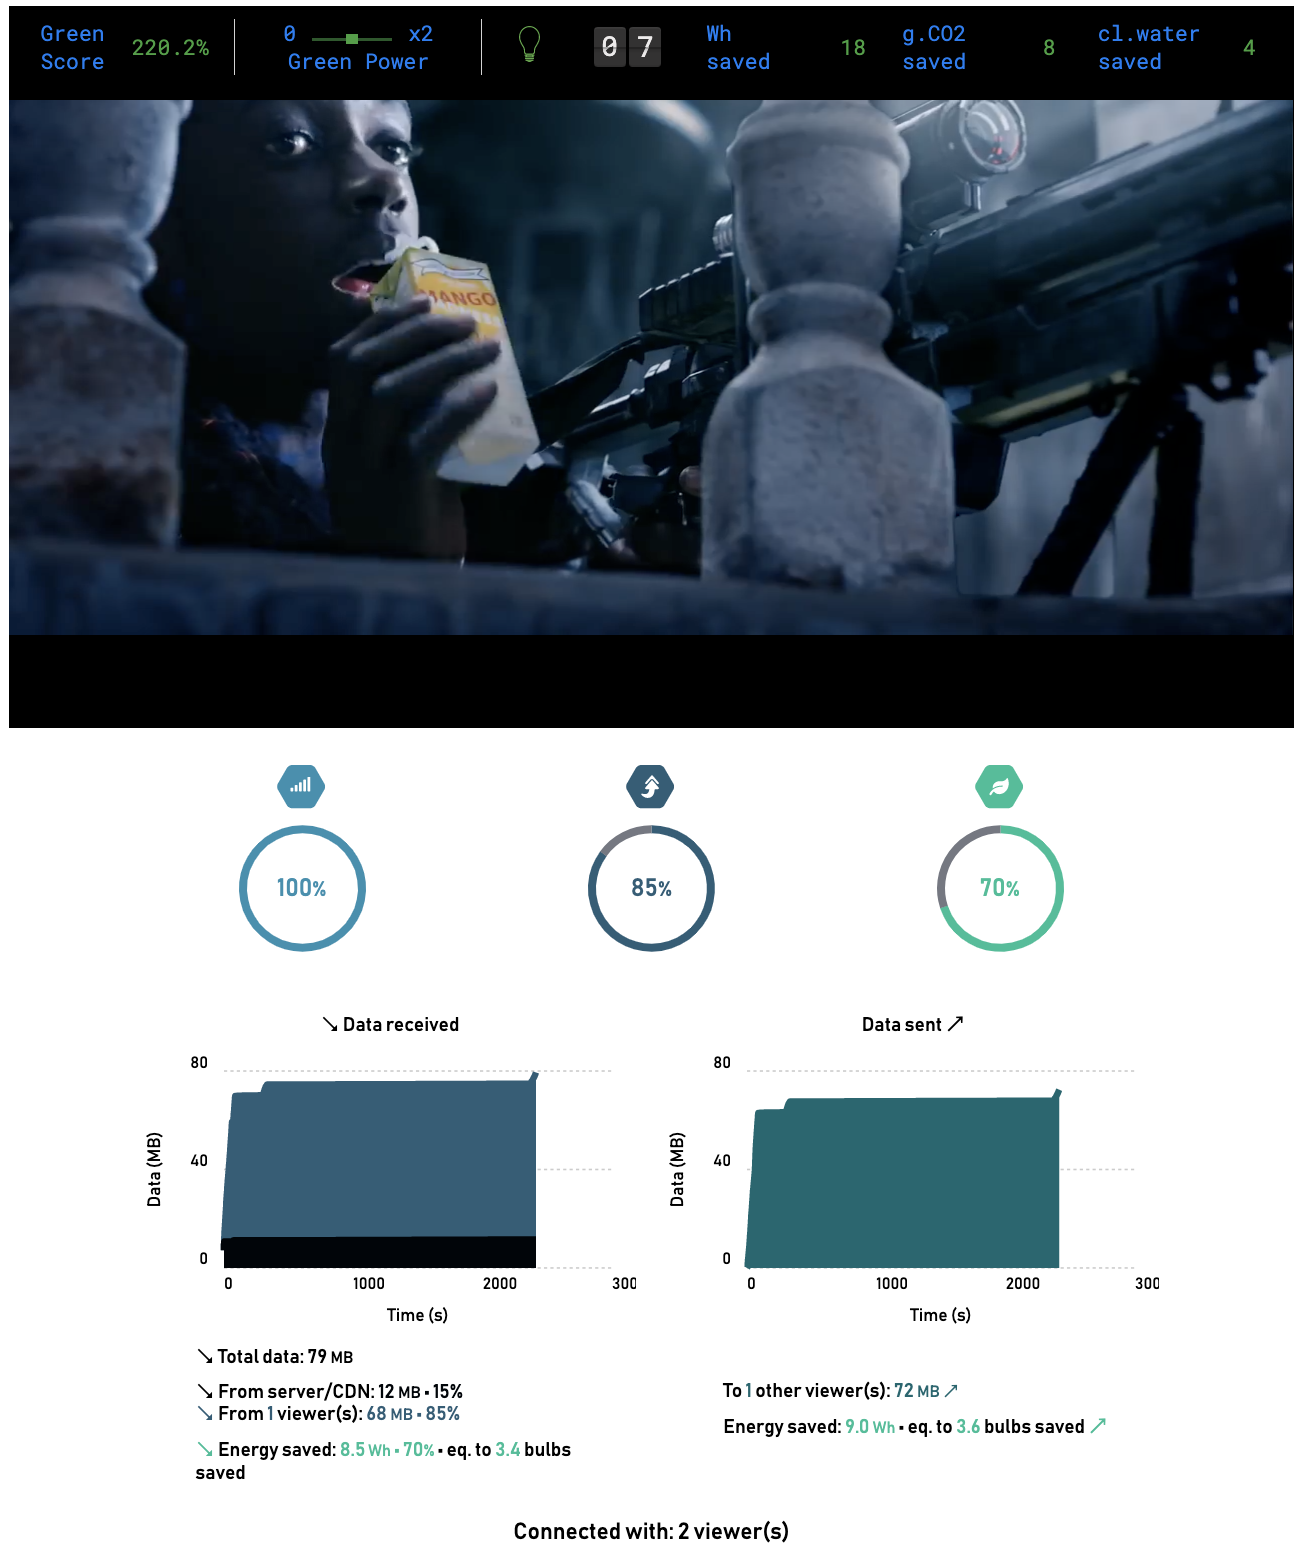
The QUANTEEC Visualization Tool is an optional add-on to display simple QUANTEEC metrics for a player, such as:
- The quantity of data downloaded from CDN and P2P
- The quantity of data sent in P2P
- The quantity of energy saved by sending or receiving data through P2P
The Visualization tool can be installed directly inside a web page, but it can also be installed as a bookmarklet to be used on any page embedding a web player with the QUANTEEC plugin.
Install as a bookmarklet
A bookmarklet is a small piece of JavaScript code that can be saved as a bookmark in your web browser. When you click on the bookmarklet, it executes the JavaScript code, allowing you to perform specific actions or enhancements on the current webpage.
The QUANTEEC Visualization tool can be saved as a bookmarklet to display the graphs in any page with QUANTEEC plugin installed.
1- First open your web browser (e.g., Chrome, Firefox, Safari).
2- Right-click on the bookmarks toolbar and open the bookmark manager.
3- Select the option to create a new bookmark.
4- Alternatively, you can use the browser menu to create a new bookmark.
In the bookmark creation dialog box, give your bookmarklet a meaningful name.
In the URL field, put the following JavaScript code:
javascript:(function(){var t=document.getElementById("quanteec-visualize-tool");if(t) {t.remove();var x=document.getElementById("quanteec-tool-script");if (x){x.remove()};}else{var e=document.createElement("script");t=document.createElement("div"),e.src="https://files.quanteec.com/visualization/latest/quanteec-visualize.min.js",e.setAttribute("id","quanteec-tool-script");t.setAttribute("id","quanteec-visualize-tool"),t.style.padding="10px",t.style.position="fixed",t.style.bottom="0%",t.style.right="0%",t.style.width="100%",t.style.height="70%",t.style.maxWidth="621px",t.style.maxHeight="500px",t.style.backgroundColor="rgba(255,255,255,0.7)",t.style.color="black",t.style.zIndex="2147483647",document.body.appendChild(e),document.body.appendChild(t)}})();
5- Finally, click the "Save" or "Add" button to save the bookmarklet.
Now, you can go to a page embedding the QUANTEEC Plugin and click on the new bookmark to open the graphs.
Install in a web page for testing/development
First, import the Visualization tool librairy inside your html page:
<script src="https://files.quanteec.com/visualization/latest/quanteec-visualize.min.js"></script>
Then, simply add a div with quanteec-visualization-tool as id in your html page.
<div id="quanteec-visualize-tool"></div>
Data and graphs should appear directly inside this div.
Customization process
According to the size set into your page, you can modify the base font-size of the QUANTEEC Visualization Tool to fit in, by specifying a custom style.
<div id="quanteec-visualize-tool" style="font-size: 10px;"></div>
By default, both global metrics and graphs are displayed. It is possible to reduce the size of the graphs by adding the attribute quanteecShow="less".
The graphs are then replaced by a button to display/hide the graphs.
<div id="quanteec-visualize-tool" quanteecShow="less"></div>
It is also possible to fully customize the "quanteec-visualize-tool" div (as any div in css), by e.g., fixing a "max-size" in order to limit its size.